Description:
X, Y coordinates points for the graph is generated randomly and put it in a trace file. The trace file is given as input file to xgraph to plot the graph. Here two trace files are plotted in the single graph.
File name: “graph2.tcl”
#-------Event scheduler object creation--------#
set ns [new Simulator]
#Creating nam file:
set nf [open Tcpred.nam w]
$ns namtrace-all $nf
#Open the trace file
set nt [open Tcpred.tr w]
$ns trace-all $nt
# graph procedure..
$ns at 1.0 "Graph"
set g [open graph.tr w]
set g1 [open graph1.tr w]
proc Graph {} {
global ns g g1
set time 1.0
set now [$ns now]
puts $g "[expr rand()*8] [expr rand()*6]"
puts $g1 "[expr rand()*8] [expr rand()*6]"
$ns at [expr $now+$time] "Graph"
}
#Finish Procedure..
proc finish {} {
global ns nf nt
exec xgraph -brb -geometry 600X500 graph.tr graph1.tr &
exit 0
}
#Calling finish procedure
$ns at 5.0 "finish"
$ns run
# How to run
$ns filename.tcl
#snapshot
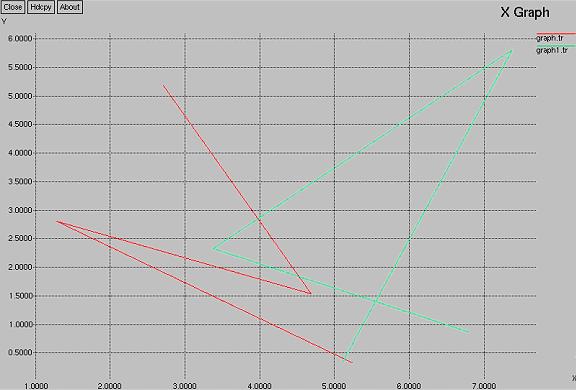
|
