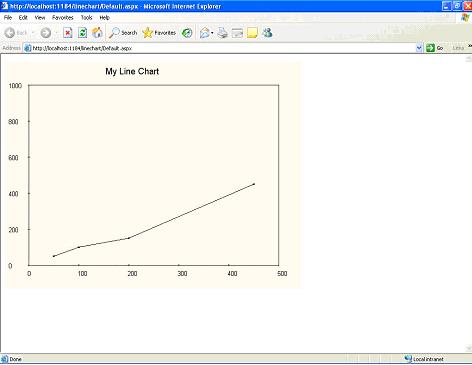
Using GDI+ encapsulated in a class to display a primitive line chart. The class features an array list to hold a dynamic number of chart points and utilizes transforms to simplify the plotting of worldview data points. Enhancements would add color options, multiple lines, other chart types, and printing.
<%@ Page Language="C#" %>
<%@ Import Namespace="System" %>
<%@ Import Namespace="System.Drawing" %>
<%@ Import Namespace="System.Drawing.Drawing2D" %>
<%@ Import Namespace="System.Drawing.Imaging" %>
<script language="C#" runat="server">
class LineChart
{
public Bitmap b;
public string Title="Default Title";
public ArrayList chartValues = new ArrayList();
public float Xorigin=0, Yorigin=0;
public float ScaleX, ScaleY;
public float Xdivs=2, Ydivs=2;
private int Width, Height;
private Graphics g;
private Page p;
struct datapoint
{
public float x;
public float y;
public bool valid;
}
public LineChart(int myWidth, int myHeight, Page myPage)
{
Width = myWidth; Height = myHeight;
ScaleX = myWidth; ScaleY = myHeight;
b = new Bitmap(myWidth, myHeight);
g = Graphics.FromImage(b);
p = myPage;
}
public void AddValue(int x, int y)
{
datapoint myPoint;
myPoint.x=x;
myPoint.y=y;
myPoint.valid=true;
chartValues.Add(myPoint);
}
public void Draw()
{
int i;
float x, y, x0, y0;
string myLabel;
Pen blackPen = new Pen(Color.Black,1);
Brush blackBrush = new SolidBrush(Color.Black);
Font axesFont = new Font("arial",10);
p.Response.ContentType="image/jpeg";
g.FillRectangle(new
SolidBrush(Color.LightYellow),0,0,Width,Height);
int ChartInset = 50;
int ChartWidth = Width-(2*ChartInset);
int ChartHeight = Height-(2*ChartInset);
g.DrawRectangle(new Pen(Color.Black,1),ChartInset,ChartInset,ChartWidth,ChartHeight);
g.DrawString(Title, new Font("arial",14), blackBrush, Width/3, 10);
for(i=0; i<=Xdivs; i++)
{
x=ChartInset+(i*ChartWidth)/Xdivs;
y=ChartHeight+ChartInset;
myLabel = (Xorigin + (ScaleX*i/Xdivs)).ToString();
g.DrawString(myLabel, axesFont, blackBrush, x-4, y+10);
g.DrawLine(blackPen, x, y+2, x, y-2);
}
for(i=0; i<=Ydivs; i++)
{
x=ChartInset;
y=ChartHeight+ChartInset-(i*ChartHeight/Ydivs);
myLabel = (Yorigin + (ScaleY*i/Ydivs)).ToString();
g.DrawString(myLabel, axesFont, blackBrush, 5, y-6);
g.DrawLine(blackPen, x+2, y, x-2, y);
}
g.RotateTransform(180);
g.TranslateTransform(0,-Height);
g.TranslateTransform(-ChartInset,ChartInset);
g.ScaleTransform(-1, 1);
datapoint prevPoint = new datapoint();
prevPoint.valid=false;
foreach(datapoint myPoint in chartValues)
{
if(prevPoint.valid==true)
{
x0=ChartWidth*(prevPoint.x-Xorigin)/ScaleX;
y0=ChartHeight*(prevPoint.y-Yorigin)/ScaleY;
x=ChartWidth*(myPoint.x-Xorigin)/ScaleX;
y=ChartHeight*(myPoint.y-Yorigin)/ScaleY;
g.DrawLine(blackPen,x0,y0,x,y);
g.FillEllipse(blackBrush,x0-2,y0-2,4,4);
g.FillEllipse(blackBrush,x-2,y-2,4,4);
}
prevPoint = myPoint;
}
b.Save(p.Response.OutputStream, ImageFormat.Jpeg);
}
~LineChart()
{
g.Dispose();
b.Dispose();
}
}
void Page_Load(Object sender, EventArgs e)
{
LineChart c = new LineChart(640, 480, Page);
c.Title="My Line Chart";
c.Xorigin=0; c.ScaleX=500; c.Xdivs=5;
c.Yorigin=0; c.ScaleY=1000; c.Ydivs=5;
c.AddValue(50,50);
c.AddValue(100,100);
c.AddValue(200,150);
c.AddValue(450,450);
c.Draw();
}
</script>
|

