|
Description:
This program is to open an icon in JTree. That means when you click any node of a tree (e.g. Color, Sports, Food) icon will be displayed on the frame. This program displays icons when you click the node of JTree. For this you need an icon to be displayed on the frame. Program uses the makeIcon () method to create a UIDefaults and sets an ImageIcon for the given specified gif file. The UIManager class keeps the current look and feel of the given image to be showed, if you click any node of the tree.
The UIManager class keeps the current look and feel and its defaults which are as follows
If the system property swing.defaultlaf is non-null, the default look and feel is used.
If the swing.properties exist and contains the swing.defaultlaf key, it uses its value as the default look and feel class uses its values. Otherwise it uses Java look and feel.
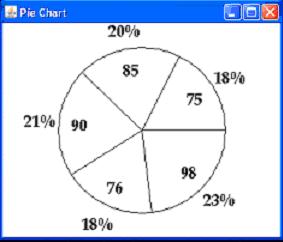
Drawing pie-chart Using Java :
import java.awt.*;
import java.awt.event.*;
import java.awt.font.*;
import java.awt.geom.*;
import java.awt.image.*;
import java.text.*;
import javax.swing.*;
public class PieChartExample
{
public static void main(String[] args)
{
JFrame f = new JFrame("Pie Chart");
f.setDefaultCloseOperation(JFrame.EXIT_ON_CLOSE);
f.getContentPane().add(new PieChartPanel());
f.setSize(350,300);
f.setLocation(300,300);
f.setVisible(true);
}
}
class PieChartPanel extends JPanel
{
BufferedImage image;
final int PAD = 30;
Font font;
NumberFormat numberFormat;
public PieChartPanel()
{
font = new Font("Book Antiqua", Font.BOLD, 20);
numberFormat = NumberFormat.getPercentInstance();
addMouseListener(new Visibility(this));
addComponentListener(new ComponentAdapter()
{});
}
protected void paintComponent(Graphics graphics)
{
super.paintComponent(graphics);
Graphics2D graphics2d = (Graphics2D)graphics;
graphics2d.setRenderingHint(RenderingHints.KEY_ANTIALIASING,
RenderingHints.VALUE_ANTIALIAS_ON);
createChartImage();
graphics2d.drawImage(image, 0, 0, this);
}
private void createChartImage()
{
int[] marks = { 98, 76, 90, 85, 75 };
int width = getWidth();
int height = getHeight();
int cp = width/2;
int cq = height/2;
image = new BufferedImage(width, height, BufferedImage.TYPE_INT_RGB);
Graphics2D g2 = image.createGraphics();
g2.setPaint(Color.white);
g2.fillRect(0, 0, width, height);
g2.setPaint(Color.black);
int pie = Math.min(width,height) - 2*PAD;
g2.draw(new Ellipse2D.Double(cp - pie/2, cq - pie/2, pie, pie));
double total = 0;
for(int j = 0; j < marks.length; j++)
total += marks[j];
double theta = 0, phi = 0;
double p, q;
for(int j = 0; j < marks.length; j++)
{
p = cp + (pie/2) * Math.cos(theta);
q = cq + (pie/2) * Math.sin(theta);
g2.draw(new Line2D.Double(cp, cq, p, q));
phi = (marks[j]/total) * 2 * Math.PI;
p = cp + (9*pie/24) * Math.cos(theta + phi/2);
q = cq + (9*pie/24) * Math.sin(theta + phi/2);
g2.setFont(font);
String st = String.valueOf(marks[j]);
FontRenderContext frc = g2.getFontRenderContext();
float textWidth = (float)font.getStringBounds(st, frc).getWidth();
LineMetrics lm = font.getLineMetrics(st, frc);
float sp = (float)(p - textWidth/2);
float sq = (float)(q + lm.getAscent()/2);
g2.drawString(st, sp, sq);
p = cp + (pie/2 + 4*PAD/5) * Math.cos(theta + phi/2);
q = cq + (pie/2 + 4*PAD/5) * Math.sin(theta+ phi/2);
st = numberFormat.format(marks[j]/total);
textWidth = (float)font.getStringBounds(st, frc).getWidth();
lm = font.getLineMetrics(st, frc);
sp = (float)(p - textWidth/2);
sq = (float)(q + lm.getAscent()/2);
g2.drawString(st, sp, sq);
theta += phi;
}
g2.dispose();
}
public void toggleVisibility()
{
repaint();
}
}
class Visibility extends MouseAdapter
{
PieChartPanel piechart;
public Visibility(PieChartPanel pc)
{
piechart = pc;
}
public void mousePressed(MouseEvent event)
{
if(event.getClickCount() > 1)
piechart.toggleVisibility();
}
}
Sample ScreenShot:
|

